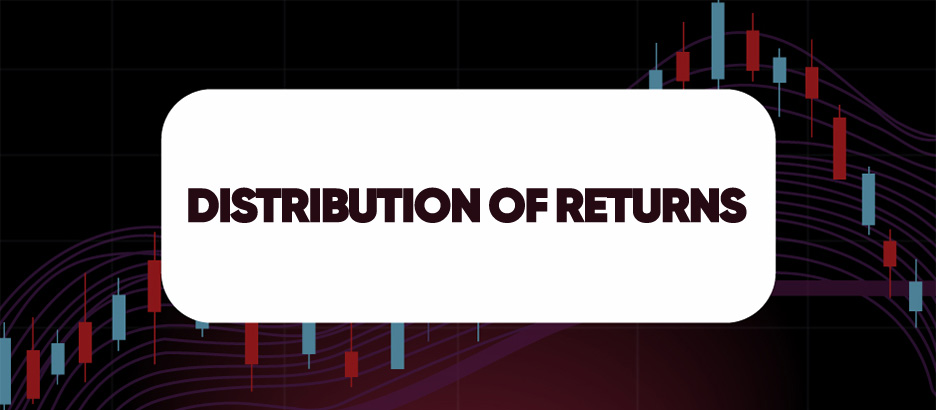
DISTRIBUTION OF RETURNS
Distribution of Returns shows the frequency and range of returns over a specified period. It helps identify patterns, volatility, and the risk-return profile of the trading strategy.
Browse categories to find relevant articles and insights.
Financial investing involves the allocation of capital to various assets such as stocks, bonds, real estate, and commodities with the expectation of generating a return. In trading, financial investing strategies can range from long-term buy-and-hold approaches to active short-term trading. Traders use different methods, such as fundamental analysis, technical analysis, and portfolio diversification, to optimize returns while managing risks. Investment decisions are driven by factors like market conditions, interest rates, and economic trends.